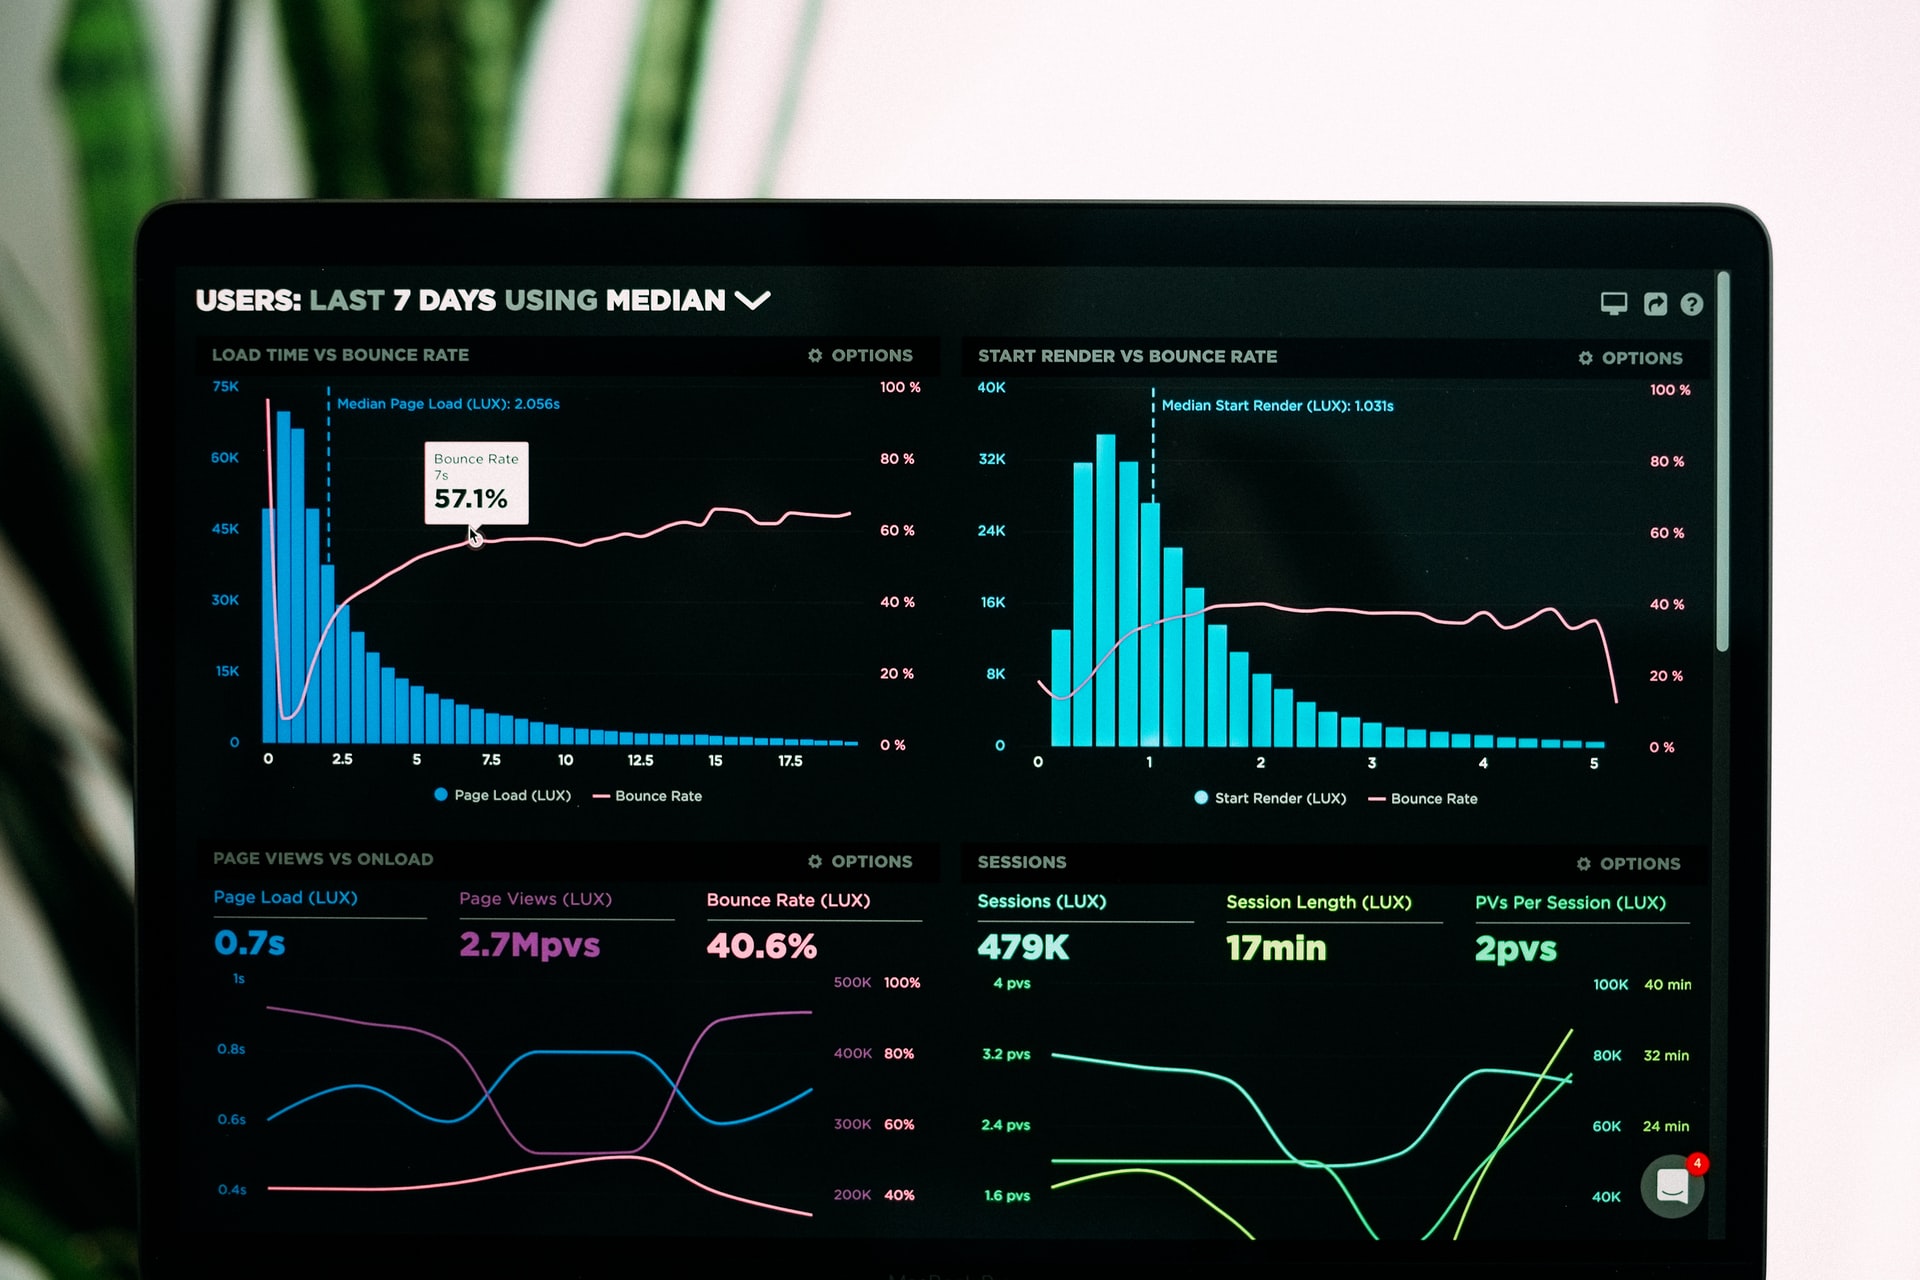
Translating complex information into visual form presents great advantages in the world today. Organizations are now able to collect more information than a single person can consume or process. Translating gigabytes of data into charts, graphs, and color-coded maps makes it easier and faster to understand complex concepts or trends. Data visualization is now considered an integral part of data science. Data visualization seeks to express information in the most efficient manner so that the target audience can relate easily to it while taking advantage of the tools we have today.
All industries and fields need data visualization. The health sector, for instance, in the last year has used visualization to show the severity of COVID-19 infections in different parts of the world and to map the distribution of vaccines. logistics companies, academic institutions, banks, and manufacturers rely on data visualization to show growth, opportunities, threats, and more. When applied correctly, here are 5 ways that data visualization can help improve team performance.
Faster Decision Making
Data visualization unlocks faster decision-making for a team. This is crucial in times of emergencies or when a decision needs to be taken quickly regarding whether to invest in new opportunities or not. Data collection has come a long way, especially with IoT technology. It’s now possible to collect data continuously in real-time. Visualization helps to make sense of changes as they happen. If a new trend is emerging, the business may need to send out a communication to customers, adjust inventory levels, or make a purchase. Whatever it is, the decision will come than it would have without data visualization.
Better Project Planning
Data visualization tools help teams understand and plan projects better. The project goals and timelines are displayed visually. Important milestones are indicated and ticked off as the team hits them. Consequently, the team stays motivated. Visualization also helps to quickly trace important project metadata, such as the project completion date, budget utilization, and proportion of work completed at a certain date.
Maintain Interest of Audiences
One of the toughest tasks that teams face is being able to present their findings and recommendations to their audience. The audience might include the board, which acts on their recommendations. In most cases, the size of a report and the complexity of the topic put off the audience. However, with a data visualization tool, it’s easier for a team to develop a narrative and explain complex topics to the audience. Maintaining the interest of the audience is key to the team doing meaningful work.
Involve Non-technical People
Data visualization tools make information more accessible and understandable. Teams do not always need to have a statistician or data scientist to help make sense of data. The team can carry out secondary research if the information has been well documented and represented. Data analysis tools today are also quite friendly because they allow users to query data and have the information displayed in ways that are easy to consume. In a company with ten product lines, a sales manager can easily find out the units of each product sold in a month or the revenue contribution of each. Representing the information in two pie charts will complement a table. Month-to-month trends in sales units and sales revenue for each product will be best presented in historical trend graphs.
Increasing Productivity of Team Members
Being able to visually represent the performance of team members can push them to improve on their own accord. Organizations collect various data points to gauge performance at the end of a period. However, taking a more real-time approach to performance tracking can have a great impact on motivation.
Take, for instance, a sales team where members earn a commission based on their margins and units sold. A visual tool can show their progress towards hitting their monthly targets. Getting closer to the target and seeing the progress bar move is psychologically rewarding. Seeing the total commissions earned increase will push them to seek more leads.
Depending on organizational policy, the tool may include a bubble graph showing the performance of other team members. As a result, friendly competition springs.
What is Good Data Visualization?
Selecting the right tool for a given type of information is perhaps the most important secret of data visualization. Mobile apps and more complicated software available in the market today have raised the standards of data visualization compared to what was available a decade ago. Good data visualization today is not only useful but also visually appealing to the eye. High-quality data representation is now ubiquitous, so if you do not meet similar standards, your content remains unutilized. Social media content with more visually appealing images and videos naturally gets more engagement.
Good data visualization tools should be scalable. As your organization grows and collects more data, the tools you build to use today should be modifiable to remain useful. This is a great quality of modern data manipulation and visualization tools in the market today. They can serve organizations of different sizes and in different industries as well. Finally, data utilization tools should be easy and fast to use, allowing for fast querying and sharing of visual images fast. This way, highly perishable information gets out in a timely fashion.
Data Visualization Improves Business Intelligence
The use cases of data visualization in business today are almost limitless. If good data is available and users can query it, users can interact with the findings visually. In fact, queries can show real-time movements or changes, and the marketing team can see conversion rates of their campaigns while production teams can track production line metrics such as units per hour. PR teams can track company mentions on social media to track sentiments or reviews. Virtually all departments in a company can benefit from being able to represent information in a more consumable manner, which makes it possible to draw useful business insights.
If your company is creating data exponentially, then data might be your most important asset. At Transcendent Software, we help businesses get useful insights from Big Data. We help clients create data repositories, normalize, and analyze data, visualize it and get actionable insights.